Implications of the Census Bureau’s Poverty Report

by Stan Duncan...


The Census Bureau’s annual poverty statistics came out last week and the numbers were ugly. Not only were they (1) uglier than we had hoped, it turns out they are (2) even worse than the Bureau says they are, and (3) they may stay ugly for generations to come.

This week’s blog is a long one because it’s a long subject. If you want to read it, but don’t have much time, read a chunk of two, go drink coffee, and come back later and pick it up. I won’t be offended.

So, let’s take a look at the report.

First, the numbers were uglier than people had hoped.[1]

If you don’t have much time, you have my permission to press print, write the words “bleak” over this section, and then move on to the next.

· Poverty [Incidentally, as a rule of thumb, the government defines poverty as an annual income of $22,025 for a family of four, $17,163 for a family of three and $14,051 for a family of two.]

* Real median income declined by $1,860 from 2007 to 2008, a decline of 3.6%, the highest one-year decline in income on record.
* General poverty reached 13.2% in 2008, up from 12.5% in 2007 (and projected to be around 14% for 2009), which is its highest level in 11 years. This increase is because so much of our anti-poverty policies today are for paid work, and the so-called, “safety net” has been cut so much that it no longer does much when the job market is bupkis.
* The family poverty rate rose to 10.3 percent in 2008, up from 9.8 percent in 2007, and projected to be around 11% by the end of 2009.
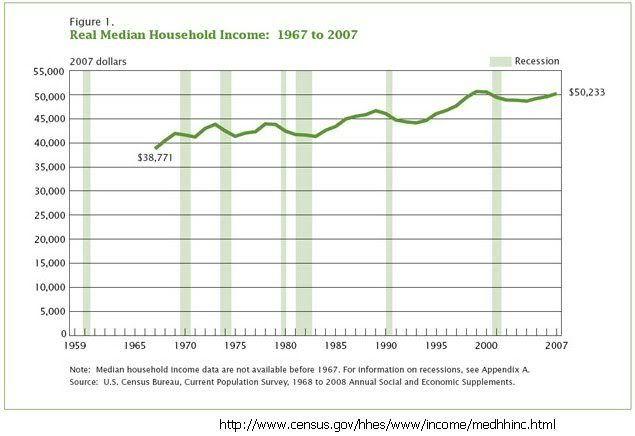
* Median household income sank 3.6% to $50,303, after adjusting for inflation, and expected to drop at least 5% more this year. That’s more sharply than any time since the government began keeping records in 1947.

A partial racial and ethnic breakdown:

* Non-Hispanic Whites, 8.6 % (17.0 million people) in 2008—up from 8.2 % (16.0 million people) in 2007.
* Blacks, 24.7% (9.4 million) up from 24% in 2007.
* Asians, 11.8 % (1.6 million), up from 10.2 % (1.3 million) in 2007.
* Hispanics, 23.2 % (11.0 million) in 2008, higher than 21.5 % (9.9 million) in 2007. (The large decline in Hispanic income in 2008 is likely related to that group's concentration in the construction industry, which has collapsed due to the bursting of the housing bubble.)[2]

Health care
* Costs continue to soar and in 2008 46.3 million people were uninsured, which was up from 45.7 million in 2007.
* [The unrelenting increases are of course why something like a “Public Option” to force the insurance companies into being more competitive is an absolute necessity for true reform. Not to sound political here, but it is interesting that as more and more people lost their job-related policies and were unable to afford private plans, more and more of them joined the government-controlled, single payer, socialized health care plans. Medicaid and S-Chip climbed from 83.0 million to 87.4 million.

Those hurt worst by the recession
* Worst hit were middle-aged households headed by 45-54-year-olds. They averaged a 5.4% drop in income.
* The only group that actually gained during the last year were people 65 and older, who participate in a radical, socialized, communist inspired, government-run, single payer health care plan and a radical socialized government-run income supplement program. Their incomes rose modestly by 1.2%.[3]


Second, the numbers are even worse than they say they are. The Federal guidelines for assessing poverty are based on ancient, out-of-date assumptions that hide much of the reality of poverty. They were developed in the 1960s and assumed that the average family spent about one third of its income on food. They set the income level for poverty to be the cost of three times a basic market basket of food. (It was later adjusted to five times, but is still just based on food.) However, since then the costs of other things have skyrocketed. What about, for example, child care, gas, commuting, home energy, or housing? All of these items have risen as a percentage of our personal expenses while food has actually gone down. Housing used to be about ten percent of a family’s annual expenses. Now it’s more than thirty. What about health care, which has gone up about thirty-five percent faster than the cost of living and has become unfordable for millions. Also, the amount of disposable income that the average family keeps after taxes (income, payroll, sales, property, etc.) is far smaller today than it was in 1960. The point here is that when all of these things are factored in, the number of people in “real” poverty is often twice that of the official numbers.[4]

To be fair, the Census Bureau knows this (see their report cited in the notes) but cannot factor these things in until Congress tells them to and don’t hold your breath. Congress has never shown an interest in changing the poverty formula. My guess is that it is because they also will prefer using a lower poverty number over higher ones because it makes us look wealthier as a nation than we really are.

Third, we may be in for some dark and stormy nights for years to come.
If you read closely in the poverty statistics you noticed some scary trends. The most ominous is that from 1998 to 2008, median incomes in America went down from $51,295 to $50,303 for a family of four, and the number of non-farm jobs — roughly 131 million — pretty much flat-lined.[5] That includes the years in the decade when we were going through the “Bush Recovery” and the economy was supposedly booming. The only time when our incomes looked like they were rising was in the last couple of years of the fake money of the housing bubble and not real money. That “growth,” as we now know, was like the pea in the old shell games. The magician keeps shuffling the pea from shell to shell giving the impression that there were many peas and each shell had a pea in it, when in reality there was just one pea moving very, very fast (and getting very tired).

To make this even scarier, here are four trivia questions for you: First, when was the last time that we have gone that long without any perceivable rise in median incomes? The answer is, 1982. Second, when was the last time we had this dramatic an increase in poverty in one year: 1991. Third, when was the last time we had a drop of 5% in employment over a period of just nine months? That was back before World War II. And finally, when was the last time we had more than twenty-seven weeks in a row of rising unemployment? The answer is nobody knows. There has never been that long a run of high unemployment since the Bureau of Labor Statistics has been collecting numbers. And that is what should scare us.

What does all of this mean?
There is a rule of thumb in economics, called “Okun’s Law,” which means roughly that when the Gross Domestic Product (GDP) goes down, jobs go down with it, and when the economy goes up, jobs (eventually) go back up with it. With all of the stimulation and economic growth we’ve had in the last six months, the “law” says that we should have around 8.5 % unemployment today. That, however, was the number we passed on our way up to 10% about four months ago. For some reason that economists can’t quite explain, Okun is letting us down. Something in the economy is broken, maybe fundamentally. Jobs seem to be unhooked from economic growth.

Presidential economic advisor, Larry Summers, back in the eighties when he was a lowly labor economist, wrote an important article analyzing Japan’s economy which had been stagnant for over a decade. He said that there were mysterious occasions when something kept Okun’s law from working and employment became unhooked from the rise and fall of the GDP. He called it “Hysteresis.” It comes from a Greek verb meaning “to lack in something central.” You have seen the word in the New Testament a few times. In Mark 12:44, for example, a widow gives alms out of her “lack” (hysterseos). Paul once said in Philippians that while he wasn’t rich, he didn’t have any real “need” (husteresis).

[A different definition and etiology comes from “path dependence” meaning that the future is dependent upon the path. Once you get started in a path, the harder it is to get out of it.]

When applied to the economy, it means that something is mysteriously missing and things aren’t working the way they should, and because it’s gone, we may never be able to return to “normal” again. Something is broken and may not be fixable. In our situation, the economy is growing but jobs are not. Trying to fix that with the old tools of monetary or fiscal policies may miss the problem because what’s missing is a deeper and more structural shift in the entire way we have functioned as a country. The term was applied to Europe in the eighties, Japan in the nineties, and it may well apply to the U.S. in the 2000s and beyond.[6] If true, it means that the old jobs just aren’t going to come back. When new jobs are created, they are invariably of poorer quality than the old ones, a trend that has no apparent likelihood of changing.

Part of the problem is, of course, inevitable. That is, seven million people lost their jobs and it’s hard to pull back to “normal” after that. People now buy fewer groceries, which means the grocer buys less from distributors, who buy less from the wholesalers, who buy less from the manufacturers. And so on until you get down to the coffee farmer in Ethiopia who can’t sell his beans and he grinds them up for mulch to sprinkle around next year. This is a downward spiral, and cannot be fixed quickly, no matter how much stimulus money is spent, even if most of it actually went to job creation, which in our case it did not.

Imagine income in America as a foot ball field. The median income is the fifty yard line. The left goal posts are the most poor. The right goal posts are the Wall Street oligarchy who rake in two and three hundred million dollars a year. The red line represents what used to be a gradual line of income going upwards. http://www.lcurve.org/ZoomShots/Zoom5.gif

But another important part is hysteresis, a critical “lack” of something in our economy that has kept us prosperous for generations. One thing increasingly lacking is justice in our politics, power, and income distribution. For at least the last thirty years there has been dramatic income growth for the top and stagnation or decline for all the rest. On average, incomes have declined by 2.5 percent among the bottom fifth of families since the late 1990s, while increasing by 9.1 percent among the top fifth. That is a structural problem and a justice problem and it will not be fixed in our lifetimes because of the enormous influence that the wealthy have over the politicians whose re-election campaigns they fund. It’s hard for a Legislator to believe one way on an issue when his re-election is being paid for by a corporate PAC that believes another.

Inflation adjusted percentage increase in after-tax household income for the top 1% and the four quintiles, between 1979 and 2005 (gains by top 1% are reflected by bottom bar; bottom quintile by top bar).[7]
http://upload.wikimedia.org/wikipedia/en/a/a4/Income_gains.jpg

A second place where the concept of hysteresis applies is in what has happened to us with economic globalization. Our historic engines of economic growth are crumbling with the advancement of international trade and nothing so far is taking their place. It is an interesting fact that whenever there has been an increase in trade, the gap between rich and poor has gotten larger with more power concentrating at the top and less at the bottom. In the most recent 25-year run of global trade (starting roughly in the early 1980s), some have become winners but many are losers. That has been true since ancient Israel traded wine for wood with its Phoenician neighbors to the north[8] and it hasn’t changed much today.[9] The spoils of trade flow upwards and with them come power and influence. That disparity will be a blight on democracy and our economic development for many, many years to come.

We are a country that became rich on small farms and big industry. Neither are sustainable any longer and we haven’t invented a new model to take their place. Since the thirties small farms have been getting larger and since the seventies industry is getting smaller. We don’t have the will to pay living wages to factory workers while China has millions of poor and starving people willing to make the same items for a dollar a day. It may very well mean that high paying jobs for middle class America are gone forever—or at least for a generation. Joe Stiglitz, speaking at a conference in Pittsburgh just before the meeting of the G-20 last week said that the American economy needed to expand at a rate of 3.2 percent a year to create more jobs than we are losing, and there was nothing visible on the horizon for many, many years that could make that happen. Something is broken in the economy and nobody knows how to fix it.

As you probably know, the U.S. manufacturing base began moving from the northeast to the south about forty years ago. Then in the mid-nineties, with NAFTA, it moved over the border to Mexico. Then beginning in 1999, when China joined the WTO, it began moving from Mexico to China. And manufacturing will probably continue to grow there for generations more. China is so large and poor and undemocratic that it will take multiple decades before its people are free enough to demand living wages. And when that happens, manufacturing will start searching out other poor countries for production. By then the U.S. will have dismantled its entire manufacturing base and suffered through profound emotional and social changes making the transition. It is unlikely that we will ever be the wealthy country we were just twenty years ago. Now, that may not be bad in terms of global justice and a vision of God’s peaceable realm. The U.S. has had too much wealth and too much power for far too long. And the damage done to the environment to keep us there is unconscionable. However, this kind of rapid re-alignment of power never comes without wrenching pain and hardship for those going through it. And as people of faith we need to gear up for a long, hurting period where our wisdom, compassion, and pastoral skills will be tested. In addition, power never gives up its perch without inflicting pain on those around it on the way down. So, look for continued punitive bitterness and reprisals from the wealthy (and those who identify with them) as they try to maintain their wealth and privilege.

How should people of faith respond to these inevitable hardships? What are the issues that our churches should become involved in to help direct the changes in more humane and environmentally friendly directions? Those well may be the most important questions that churches and faith groups will be asking themselves for the next generation.

P.S.
I’m working on an article right now with some biblical reflections on that. It includes discussions of Jesus on goods and services distribution, the Apostle Paul on the establishment of a functioning regulatory framework for trade, and Moses on derivatives trading. I’ll post a draft of it next week and I would very, very much appreciate your thoughts and comments. It’s half tongue-in-cheek, of course. There’s not much in the Bible that has to do with derivatives or credit default swaps, but I do think there are a few faithful, biblically grounded principles for a progressive response to the long-term poverty prospects that loom out in front of us. And I’d like to draw out a few of them for your comments.

In the meantime, print out this post, write the word “bleak” all over it and go drink a cup of coffee.

Notes:
[1] Carmen DeNavas-Walt, Bernadette D. Proctor, Jessica C. Smith Income, Poverty, and Health Insurance Coverage in the United States: 2008 (U.S. Census Bureau P60-236(RV): September 2009).
[2] Heidi Shierholz, “New 2008 poverty, income data reveal only tip of the recession iceberg” (Washington, DC: Economic Policy Institute, September 10, 2009), http://www.epi.org/publications/entry/income_picture_20090910.
[3] Stephen Lendman, “US Census Bureau Confirms Rising Poverty, Falling Incomes, and Growing Numbers of Uninsured: Wall Street is improving but Main Street is worsening in every way. (The Baltimore News Network/Baltimore Chronicle), September 14, 2009.
[4] Shawn Fremstad, Measuring Poverty and Economic Inclusion: The Current Poverty Measure, the NAS Alternative, and the Case for a Truly New Approach, Washington, DC: Center for Economic and Policy Research, December 2008.
[5] David Leonhardt, “A Decade With No Income Gains” (New York Times, September 10, 2009) http://economix.blogs.nytimes.com/2009/09/10/a-decade-with-no-income-gain; Clive Corcoran, “U.S. Median Income from 1999-2009: No Gain, Much Pain,” Seeking Alpha, September 13, 2009, http://seekingalpha.com/article/161271-u-s-median-income-from-1999-2009-no-gain-much-pain?source=article_lb_articles.
[6] Joshua Cooper Ramo, “Jobless in America: Is Double-Digit Unemployment Here to Stay?” Time Magazine, Friday, Sep. 11, 2009, p. 45.
[7] Source: Aron-Dine, A. & Sherman, A. “New CBO Data Show Income Inequality Continues to Widen: After-tax-income for Top 1 Percent Rose by $146,000 in 2004” (Center for Budget and Policy Priorities: January 23, 2007), p. 2.
[8] Roland de Vaux, Ancient Israel Vol. 2 (New York: McGraw-Hill, 1965), p. 481.
[9] See for example, Mark Weisbrot, Robert Naiman, and Joyce Kim, The Emperor Has No Growth: Declining Economic Growth Rates in the Era of Globalization (Washington, DC, Center for Economic Policy Research, November 27, 2000). Also, Aron-Dine, A. & Sherman, A. op.cit., pp. 2-4.

The Continuing Disaster of Wall Street, One Year Later

by Robert Reich

Robert Reich is a professor at the University of California at Berkeley and a former U.S. Secretary of Labor.

Week of 9.18.09

As he attempted to do with health care reform last week, the President is trying to breathe new life into financial reform. He’s using the anniversary of the death of Lehman Brothers and the near-death experience of the rest of the Street, culminating with a $600 billion taxpayer financed bailout, to summon the political will for change. Yet the prospects seem dubious. As with health care reform, he has stood on the sidelines for months and allowed vested interests to frame the debate. Nor has he come up with a sufficiently bold or coherent set of reforms likely to change the way the Street does business, even if enacted.

Let’s be clear: The Street today is up to the same tricks it was playing before its near-death experience. Derivatives, derivatives of derivatives, fancy-dance trading schemes, high-risk bets. “Our model really never changed, we’ve said very consistently that our business model remained the same,” says Goldman Sach’s chief financial officer.

The only difference now is that the Street’s biggest banks know for sure they’ll be bailed out by the federal government if their bets turn sour—which means even bigger bets and bigger bucks.

“As with health care reform, [President Obama] has stood on the sidelines for months and allowed vested interests to frame the debate.”

Meanwhile, the banks’ gigantic pile of non-performing loans is also growing bigger, as more and more jobless Americans can’t pay their mortgages, credit card bills, and car loans. So forget any new lending to Main Street. Small businesses still can’t get loans. Even credit-worthy borrowers are having a hard time getting new mortgages.

The mega-bailout of Wall Street accomplished little. The only big winners have been top bank executives and traders, whose pay packages are once again in the stratosphere. Banks have been so eager to lure and keep top deal makers and traders they’ve even revived the practice of offering ironclad, multimillion-dollar payments - guaranteed no matter how the employee performs. Goldman Sachs is on course to hand out bonuses that could rival its record pre-meltdown paydays. In the second quarter this year it posted its fattest quarterly profit in its 140-year history, and earmarked $11.4 billion to compensate its happy campers. Which translates into about $770,000 per Goldman employee on average, just about what they earned at height of boom. Of course, top executives and traders will pocket much more.

Every other big bank feels it has to match Goldman’s pay packages if it wants to hold on to its “talent.” Citigroup, still on life-support courtesy of $45 billion from American taxpayers, has told the White House it needs to pay its twenty-five top executives an average of $10 million each this year, and award its best trader $100 million.

“The mega-bailout of Wall Street accomplished little. The only big winners have been top bank executives and traders...”

A few banks like Goldman have officially repaid their TARP money but look more closely and you’ll find that every one of them is still on the public dole. Goldman won’t repay taxpayers the $13 billion it never would have collected from AIG had we not kept AIG alive. (In one of the most blatant conflicts of interest in all of American history, Goldman CEO Lloyd Blankfein attended the closed-door meeting last fall where then Treasury Secretary Hank Paulson, who was formerly Goldman’s CEO, and Tim Geithner, then at the New York Fed, made the decision to bail out AIG.) Meanwhile, Goldman is still depending on $28 billion in outstanding debt issued cheaply with the backing of the Federal Deposit Insurance Corporation. Which means you and I are still indirectly funding Goldman’s high-risk operations.

So will the President succeed on financial reform? I wish I could be optimistic. His milktoast list of proposed reforms is inadequate to the task, even if adopted. The Street’s behavior since its bailout should be proof enough that halfway measures won’t do. The basic function of commercial banking in our economic system—linking savers to borrowers—should never have been confused with the casino-like function of investment banking. Securitization, whereby loans are turned into securities traded around the world, has made lenders unaccountable for the risks they take on. The Glass-Steagall Act should be resurrected. Pension and 401 (k) plans, meanwhile, should never have been allowed to subject their beneficiaries to the risks that Wall Street gamblers routinely run. Put simply, the Street has been given too many opportunities to play too many games with other peoples’ money.

“[President Obama’s] milktoast list of proposed reforms is inadequate to the task, even if adopted.”

But, like the health care industry, Wall Street has platoons of lobbyists and an almost unlimited war chest to protect its interests and prevent change. And with the Dow Jones Industrial Average trending upward again—and the public’s and the media’s attention focused elsewhere, especially on health care—it will be difficult to summon the same sense of urgency financial reform commanded six months ago.

Yet without substantial reform, the nation and the world will almost certainly be plunged into the same crisis or worse at some point in the not-too-distant future. Wall Street’s major banks are already en route to their old, dangerous ways—now made more dangerous by their sure knowledge that they are too big to fail.


http://www.pbs.org/now/shows/538/reich-wall-street.html

Fair Trade: The story

A fine video by Transfair about the meaning of "Fair Trade."

US Census Bureau Confirms Rising Poverty, Falling Incomes, and Growing Numbers of Uninsured

Wall Street is improving but Main Street is worsening in every way.

by Stephen Lendman
Monday, 14 September 2009

In early September, The US Census Bureau released its new report titled, "Income, Poverty, and Health Insurance Coverage in the United States: 2008" showing disturbing data that portends much worse ahead under a president and Congress doing nothing to address it.

In 2008, poverty reached 13.2% of the population, its highest level in 11 years, the result of millions losing jobs during the first year of the gravest economic crisis since the 1930s. For blacks, the figure was nearly double at 24.7%, and 31% of all Americans were impoverished for at least two months between 2004 and 2007, years of economic expansion.

At yearend 2008, even by the Bureau's conservative measures, 39.8 million people were impoverished, the highest level since 1960, and 17.1 million lived in extreme poverty at below one-half the official threshold. In addition, for the first time since the 1930s, median household income failed to increase over a 10-year period from 1999 - 2008.

The Census Bureau states that it "presents annual estimates of median household income and poverty by state and other smaller geographic units based on data collected in the American Community Survey (ACS)" covering population areas of 20,000 or more. The Bureau's Small Area Income and Poverty Estimates (SAIPE) program also produces yearly figures "for states and all counties, as well as population and poverty estimates for school districts." It uses data from a variety of sources, including surveys, administrative records, inter-censal population estimates, and personal income data published by the Bureau of Economic Analysis.

Critics maintain that official government figures way understate the gravity of today's crisis, and the Bureau says:

"The official poverty thresholds were developed more than 40 years ago and have been criticized for not taking into account rising (or since the 1970s inflation-adjusted falling) standards of living, expenses such as child care that are necessary to hold a job, variations in medical costs across population groups (that have skyrocketed nationally and are now unaffordable for millions), and geographic differences in the cost of living."

In addition, income and poverty estimates are pre-tax and exclude non-cash benefits, usually employer-provided. Disposable personal income, after income, payroll, sales, property and other taxes, reveals a far higher poverty level than the Census Bureau reports and a much graver crisis for growing millions as the economic decline deepens.

The Bureau reported that 2008 median (inflation adjusted) household income fell 3.6%, the largest single-year decline on record to the lowest level since 1997 and falling as conditions continue to worsen.

The plight of the poor and impoverished shows up in numerous other reports that paint a darker picture than the Census Bureau and suggest much worse ahead:

  • an unprecedented, growing disparity between the very rich and other income groups;
  • economists Thomas Piketty and Emmanuel Saez's research showing the top 1% of households got two-thirds of the national income growth during the last recovery, a larger share than at any time since the 1920s;
  • wages losing ground to inflation;
  • millions of children dependent on school lunches for a hot meal;
  • an Economic Policy Institute estimate of one-quarter of all children living in poverty by yearend 2009;
  • the continued erosion of employer and government-provided benefits, including at the state and local levels; the growing uninsured crisis is discussed below;
  • greater numbers of households unable to meet expenses, even with two working members;
  • added duress from state budget cutbacks;
  • record numbers of food stamp recipients;
  • persistent and growing hunger and homelessness; and
  • job losses and higher unemployment continuing for many more months with some analysts projecting record high numbers before peaking.

A September 11 Kissinger Associates Joshua Ramo story in Time magazine highlighted the problem. Titled, "Jobless in America: Is Double-Digit Unemployment Here to Stay," it quoted Larry Summers' remarks last July before the Peterson Institute for International Economics about the disturbing rate of job losses. He suggested something strange was happening, unpredicted by experts:

"I don't think that anyone fully understands this phenomenon," he said. Will job losses mount longer than expected? At the "recession's" end, will low numbers of new ones follow, and will double-digit unemployment persist and remain common?

Without saying it, Summers wondered if America's economic model was broken, and if so how to fix it. Or can it be fixed? According to the Peterson Institute's Jacob Kirkegaard, "It is entirely possible that what started as a cyclical rise in unemployment could end up as an entrenched problem."

Summers earned his reputation as an employment theorist. He now believes that earlier unemployment views are "importantly wrong. I thought if you could have areas where there was long-term substantial unemployment, then that raised some questions about the functioning of markets."

In 1986, he wrote an article titled, "Hysteresis and the European Unemployment Problem." Hysteresis is the Greek word for late, referring to what happens when something snaps and can't be fixed. It's an idea economists deplore applying to economies, preferring instead to cite normal business cycle ups and downs. Yet in 1986, Summers argued that Europe's unemployment might be chronic and persist in times of growth.

Today's are another matter at a time of a changing economic landscape perhaps suggesting that hysteresis is confronting America, and many lost jobs aren't coming back, especially better paying ones. That's Kirkegaard's view in saying growth won't put Americans back to work, and new jobs created will be poorer quality than old ones.

So what can be done going forward? Unlike in the 1930s, machines now do much of the work that people did then on infrastructure projects. And it's a lot harder converting white collar workers to blue collar ones. Moreover, Summers' own research concludes that the traditional Western economic model won't alleviate the jobs crisis, so what will?

Summers won't say it, but short of a total remake of "free market" economics, likely nothing and perhaps that's America's future with growing millions consigned to a permanent underclass, while an elite few at the top grow richer, until one day "hysteresis" snaps the system in a disruptive convulsion, the old model passes from the scene, and nothing is the same again.

More Evidence of Economic Duress in the Latest Federal Research Report on Consumer Credit

On September 8, the Federal Reserve reported that total consumer credit fell by a record $21.6 billion in July (the sixth consecutive monthly decline) and year-over-year by $2.47 trillion or 10.4%. According to Bernard Baumohl, The Economic Outlook Group's chief global economist:

"It is one more important sign that consumers are not going to be contributing very much to the economy for the balance of this year and probably for (at least) a good part of next year." Shrinking credit's impact on consumption indicates an economy in decline. It shows up in growing poverty, falling incomes, and greater duress for growing millions, sure to be reflected in the Bureau's 2009 report.

Continued Erosion of Health Care Coverage

In 2008, the Bureau also collected data on health insurance coverage, putting the number of uninsured at 46.3 million last year (15.4% of the population), or an increase of 682,000 over 2007. It was the eighth consecutive year that fewer workers got employer-provided coverage, and those with it had to pay more of the cost.

Other estimates are far grimmer. Some, including the Congressional Budget Office, place the current uninsured total at about 50 million, and a May 2009 Todd Gilmer - Richard Kronick study estimated that 191,670 more lose coverage monthly, 2.3 million annually at the present rate, and an expected 6.9 million more Americans (over 2007) will lack it by yearend 2010 if the present trend continues.

Add to these the underinsured. According to the American Public Health Association, at least another 25 million at great risk if they face a serious health problem not covered by their present plan. In addition, Families USA estimates about 90 million Americans had no health insurance during some portion of 2007 or 2008. The Henry J. Kaiser Family Foundation reported that over 80% of the uninsured come from working families, and the Agency for Healthcare Research and Quality estimated that 27% of under aged-65 year old Americans lack coverage.

Still other estimates project up to 60 million uninsured if the commonly reported U-3 unemployment rate hits 10%, and the Urban Institute sees around 66 million without coverage by 2019, given the present trend of rising costs forcing employers increasingly to cut back.

Bureau data show that coverage weakened across most sectors of the population, including full-time workers and the middle class, the result of economic decline and years of employers putting a greater burden on their workforce.

Since at least 2001, the percent of workers with employer-provided insurance has steadily eroded, and it's the main reason behind growing numbers of uninsured and underinsured. In 2008, 61.9% of the below-aged 65 population had job-provided coverage, down from 67% in 2001 and falling due to cost cutting, continued job losses, and the trend to lower-paying ones.

In addition, holding a job no longer guarantees coverage. Plans offered have been greatly eroded, and medical expenses today are the leading cause of personal bankruptcies. America is the world's only industrialized country denying its citizens universal coverage, yet spends on average more than double the other 30 OECD countries and delivers less for it because of unaffordable private insurance and overpriced drugs.

Nothing being debated in Washington addresses this, so whatever legislation emerges will make a dysfunctional system worse with the American public betrayed by "a slick-talking street hustler"- what analyst Bob Chapman calls Obama, or according to James Petras, "the greatest con man in recent history." Make that plural with Congress under Democrat or Republican leadership because both parties are beholden to the corporate interests that own them and are indifferent to growing public needs.

Since taking office in January, Obama kept reform off the table, made progressive change a nonstarter, and achieved the impossible by governing worse than George Bush on virtually all of his domestic and foreign policies.

Since taking office in January, Obama kept reform off the table, made progressive change a nonstarter, and achieved the impossible by governing worse than George Bush on virtually all of his domestic and foreign policies. Along with looting the federal Treasury, wrecking the economy, selling out to Wall Street, and continuing imperial wars, Obamacare is the centerpiece of his failed agenda and a betrayal of the public's trust.

On September 9, he presented his vision to a joint congressional session, reassuring providers that their interests are secure. Rejecting universal single-payer coverage, he said it "makes more sense to build on what works and fix what doesn't, rather than try to build an entirely new system from scratch." And while favoring a "public option," he assured private insurers that it's not a deal-breaker, guaranteeing that no final plan will include one because enough votes can't be gotten in the Senate.

Key also is lowering costs by:

  • cutting hundreds of billions in Medicare and Medicaid benefits as a prelude to eliminating or greatly gutting these programs with perhaps Social Security and other social gains to follow;
  • placing caps on what tests and treatments doctors can provide;
  • putting "medical expert" gatekeepers in charge of deciding the most cost-effective care, thus preventing doctors from prescribing what's best for their patients and denying people the right to make their own health care choices if their cost exceeds what Washington will allow;
  • taxing so-called "Cadillac" plans (mostly covering state employees, municipal union members, and other working Americans, not just the super-rich) to encourage employers to provide fewer benefits, thus placing a greater burden on workers; forcing everyone to have insurance; and placing a surtax on non-compliars with incomes of between 100 - 300% of the poverty level under the Baucus Senate plan;
  • creating a "deficit trigger" to reduce the growth of Medicare and Medicaid spending if anticipated savings aren't met; and
  • making everyone more responsible for their own care by forcing them to cover more of the cost in return for less coverage when they need it most.

Numerous details remain hidden from the public, but the goal of Obamacare is clear. It's a scheme to ration care; charge people more for it; enrich private insurers, PhRMA, and large hospital chains; mandate insurance for everyone; and penalize non-compliars. It's up to public outrage to stop it.


Steve Lendman

Stephen Lendman is a Research Associate of the Centre for Research on Globalization. He lives in Chicago and can be reached at lendmanstephen@sbcglobal.net.

Also visit his blog site at sjlendman.blogspot.com and listen to The Global Research News Hour on RepublicBroadcasting.org Mondays from 11AM to 1PM US Central time for cutting-edge discussions with distinguished guests on world and national topics. All programs are archived for easy listening.

Mr. Lendman's stories are republished in the Baltimore Chronicle with permission of the author.


Copyright © 2009 The Baltimore News Network. All rights reserved.